Texas Truck Repair
Introduction
The trucking industry has undergone a technological revolution with the introduction of electronic logging devices (ELDs). Designed to ensure compliance with hours-of-service (HOS) rules, these devices track driving hours and prevent driver fatigue. However, with strict regulations come loopholes, and some trucking companies and commercial drivers find ways to manipulate their ELD software.
ELD tampering is more than just breaking the rules—it’s a dangerous game that puts lives at risk. Let’s uncover the dark truth behind ELD manipulation, how it happens, and why it’s a growing concern.
Why Does ELD Manipulation Occur?
The pressure to meet delivery deadlines, avoid fines, and maximize profits often drives trucking companies and commercial drivers to manipulate their ELD systems. Some common reasons include:
Increased Driving Hours – The stricter the HOS rules, the harder it becomes for truck companies to move freight efficiently. Some drivers feel compelled to exceed limits to meet unrealistic schedules.
Financial Incentives – Long haul trucking means longer hours, and more hours equal more money. Certain companies turn a blind eye to falsified logs to keep deliveries on track.
Company Pressure – Some employers push drivers to complete runs faster, even if it means tampering with the ELD rider software to extend driving hours.
Avoiding Penalties – HOS violations can lead to hefty fines from the Federal Motor Carrier Safety Administration (FMCSA), leading some to manipulate logs rather than face penalties.
How is ELD Manipulation Executed?
Manipulating an electronic logging device isn’t as simple as flipping a switch. It often involves calculated techniques, including:
Plugging into Truck Engines – Some drivers use external devices to alter log data. These plug-in tools override the ELD software, making it appear as if a truck isn’t moving when it actually is.
Ghost Drivers – Some companies assign logs to non-existent drivers, making it seem like two drivers are sharing the load when in reality, one driver is overworked.
Editing Log Entries – Certain ELD vendors offer back-end access, allowing ELD Rider representatives or fleet managers to tweak logs after the fact.
Switching to Personal Conveyance – Drivers misuse the “personal conveyance” status, making trips appear non-work-related to bypass HOS rules.
The Ripple Effect: Impacts of ELD Manipulation
Falsifying ELD data isn’t just about squeezing in extra miles—it has serious consequences.
Increased Fatigue & Accidents – Overworked drivers experience exhaustion, leading to slower reaction times and higher accident risks.
Liability for Trucking Companies – If caught, companies face penalties from the FMCSA, loss of licenses, and legal troubles.
Unfair Competition – Law-abiding trucking companies suffer when dishonest carriers cut corners and take on more loads illegally.
Faulty Truck Servicing – Trucks that exceed legal driving limits miss maintenance schedules, leading to dangerous breakdowns on highways.
What Can Be Done?
Stronger Enforcement – The Federal Motor Carrier authorities must step up audits and enforce stricter penalties.
More Accountability from ELD Vendors – Companies offering ELD Rider software must tighten security measures to prevent unauthorized tampering.
Better Education for Drivers – Many drivers don’t fully understand the risks of ELD failure or how to properly use an electronic logging device. Training is key. Random Inspections at Truck Shops – Regular checks at truck servicing locations can help catch manipulated systems before they hit the road.
Manipulating an electronic logging device may seem like a shortcut, but the risks far outweigh the benefits. Safety should always come first in the trucking industry, and that starts with enforcing compliance, supporting honest drivers, and holding lawbreakers accountable.
The road ahead must be one of responsibility, not deception.
Frequently Asked Questions (FAQs)
- What is ELD manipulation and why is it dangerous?
ELD manipulation refers to tampering with electronic logging devices to falsify driving hours or hide violations. It’s dangerous because it enables driver fatigue, increases the risk of accidents, and undermines road safety.
- How do truck drivers or companies manipulate ELD data?
Common tactics include using external devices to override log data, assigning logs to “ghost drivers,” editing log entries through back-end access, or misusing the “personal conveyance” status to disguise work-related driving.
- What are the legal consequences of ELD tampering?
Tampering with ELDs is a federal offense. Trucking companies and drivers caught manipulating logs can face hefty fines, loss of operating authority, damaged reputations, and even criminal charges under FMCSA regulations.
- How can authorities detect ELD fraud during inspections?
Enforcement officers may check for inconsistencies in mileage, review GPS data, compare driver logs with supporting documents, and use telematics tools to uncover manipulation. Surprise audits and roadside inspections are key detection methods.
- What steps can trucking companies take to prevent ELD manipulation?
Companies can implement stricter internal audits, provide regular training on HOS compliance, choose secure and FMCSA-approved ELD vendors, and enforce zero-tolerance policies for tampering or non-compliance.
Log falsification remains the number one hours-of-service-related violation. Many people mistakenly believed that falsification would be a thing of the past once electronic logging devices (ELDs) were in widespread use. However, while ELDs made falsification harder and easier to spot (by officers and companies alike), it did not stop the practice.
Here are the common methods drivers use to falsify, followed by how you can catch it, and what you should do about it:
- Logging out when a limit is reached and then continuing to drive.
- How you can catch it: This becomes evident when you assign the unassigned driving time to the driver.
- What you should do about it: This type of falsification is why it is critical that you run an unassigned driving report each day and quickly deal with any unassigned driving time (see 395.32)!
- Driving without logging in to make a break long enough.
- How you can catch it: This is also evident when the unassigned driving time is assigned to the driver.
- What you should do about it: This is another reason quickly dealing with unassigned driving time is so important!
- Using one of the special driving categories (personal conveyance or yard move) to hide on-duty and driving time or to keep driving time from being recorded as driving.
- How you can catch it: Run a report that shows the use of these driving categories and make sure the use was legitimate.
- What you should do about it: If personal conveyance was used, you need to verify the driver was not moving down the assigned route line, did no work for the company, and did not end up in a better location as far as the company was concerned. If yard move was used, you need to verify the driver was in a yard (a privately owned area not open to public travel) during the movement (see 395.28 and Interpretation Question 26 to 395.8).
- Editing to create more hours.
- How you can catch it: This can be seen by running an edit report and looking for drivers who were short on hours and who edited a bunch of on-duty time to make it off-duty time.
- What you should do about it: Verify that the edits matching the falsification profile (on-duty to off-duty time) are legitimate edits (done to correct an error or omission). A common reason for such an edit is the driver forgetting to log out at the end of the day. This will be obvious. However, if the edit was done at a loading, unloading, fueling, or inspection location, the edit should be suspect (see 395.30).
- The appearance of ghost driver accounts.
- How you can catch it: These are driver accounts that do not have an actual driver assigned to them. These accounts are prohibited in the regulations (395.22) and are a common place for drivers to hide driving time.
- What you should do about it: To see if you have any ghost drivers, compare your driver roster to the driver list in your ELD system. If you discover a ghost driver, find out who created it and who has been using it.
- Minimizing on-duty time.
- How you can catch it: When looking at summary reports, be on the lookout for drivers who have the same amount of on-duty time each day (called cookie cutter logging) or have little or no on-duty time.
- What you should do about it: Look for specific patterns. When a driver is doing cookie cutter logging, the driver will always log the exact same amount of time for on-duty activities (for example, always five minutes for a pretrip or fueling and always fifteen minutes for loading or unloading, etc.) and the on-duty time will be surrounded by off-duty time. Also be on the lookout for drivers who have fewer on-duty hours than a typical driver at your company.
By watching for these and other common methods drivers use to falsify their logs — and taking quick action when falsification is found — you will go a long way toward reducing this common violation and improving highway safety in 2024 and beyond.
Key to remember: ELDs did not make falsification impossible. However, they did make it easier to see if you know what you are looking for and where to look.
FMCSA has been taking a CLOSE look at self-certification of ELDs and finding those that are not compliant. If you are in doubt or questioning if the ELD your fleet is using meets the requirements in 49CFR part 395, the check list below will help.
Guide to ELD Compliance
There are a lot of nuances to this regulation, so we put together this very lengthy guide as a checklist to verify that your operation is compliant.
Mark Abrahamson
Approved Devices
Is the ELD listed on the Federal Motor Carrier Safety Administration’s registered ELDs list?
The full list is accessible through the Agency’s Web site, www.fmcsa.dot.gov/devices.
As a motor carrier, how can I be sure an electronic logging device (ELD) is compliant?
You should only purchase an ELD that is self-certified by the manufacturer to be compliant and that is registered and listed on the FMCSA website. (The ELDs on the approved list may not meet the requirements in part 395) The list of registered ELDs can be found at https://3pdp.fmcsa.dot.gov/ELD/ELDList.aspx. Motor carriers should also familiarize themselves with the ELD checklist and the ELD rule, located at https://www.fmcsa.dot.gov/hours-service/elds/drivers-and-carriers.
Portable ELDs
If ELD is portable, is the mounting in a fixed position and visible to the driver when the driver is seated in the normal driving position?
An ELD can be on a smartphone or other wireless device if the device meets the ELD rule’s technical specifications.
In-vehicle information
Do you have an an ELD information packet with the following items onboard the CMV?
- A user’s manual describing how to operate the ELD.
- An instruction sheet describing the step-by-step ELD’s data transfer instructions to produce and transfer records to a safety official.
- An instruction sheet describing ELD malfunction reporting requirements and recordkeeping procedures during ELD malfunctions.
- A minimum of 8 days’ supply of blank driver’s records of duty status graph-grids.
The user manual, instruction sheet, and malfunction instruction sheet can be in electronic form.
Account Types
Is an indicator designating whether an ELD account is an driver account or support personnel (non-driver) account. This enables safety officials to verify account type specific requirements. Is the account configured as required below?
Drivers:
- Driver’s first and last name, as reflected on the driver’s license.
- A unique ELD username selected by the motor carrier; (No Social Security nor Operators License numbers can be used)
- The driver’s valid driver’s license number (validity checked); and
- Ensures that only one driver account can be created per individual. This is Mandatory for all driver accounts created on the ELD; optional for “non-driver”
- The State or jurisdiction that issued the driver’s license.
A driver account must not have administrative rights to create new accounts on the ELD.
Support personnel:
- The individual’s first and last name, as reflected on a government issued identification.
- A unique ELD username selected by the motor carrier. Used to authenticate the corresponding individual during an ELD login process.
- The ELD must restrict availability of motor carrier entries outlined in Section 4 Appendix A of Part 395 only to authenticated “support personnel” account holders.
A support personnel account must not allow recording of ELD data for its account holder.
ELD Configuration
An ELD must allow a motor carrier to configure the availability of each of the three categories (Personal Use, Yard Move, and None-default) that the motor carrier chooses to authorize for each of its drivers. By default, none of these categories must be available to a new driver account without the motor carrier proactively configuring their availability.
Changes to the configuration setting must be recorded on the ELD and communicated to the applicable authenticated driver during the ELD login process.
If a motor carrier configures a driver account as exempt:
- The ELD must present the configured indication that is in effect for that driver during the ELD login and logout processes.
- The ELD must continue to record ELD driving time but suspend detection of missing data elements data, diagnostic events, and data transfer compliance monitoring when the driver is authenticated on the ELD.
ELD Function
Does the ELD power on and become fully functional within 1 minute of the vehicle’s engine receiving power and remains powered for as long as the vehicle’s engine stays powered?
If a driver does not log onto the ELD, as soon as the vehicle is in motion, the ELD must provide a visual or visual and audible warning reminding the driver to stop and log in to the ELD. It must record accumulated driving and on-duty, not-driving, time in accordance with the ELD defaults under the unidentified driver profile; and not allow entry of any information into the ELD other than a response to the login prompt.
Is the ELD integrally synchronized with the engine by an establish a link to the engine ECM when the CMV’s engine is powered and receive automatically the engine’s power status, vehicle’s motion status, miles driven value, and engine hours value through the serial or Control Area Network communication protocols supported by the vehicle’s engine ECM ?
Is a physical connection between the ECM and ELD required in order to establish integral synchronization with the engine?
No. The ECM and ELD may be connected by serial or Control Area Network communication protocols. Hard wiring to the J1939 plug and Bluetooth connectivity are examples of methods of receiving the data from the ECM or vehicle data bus.
Does the ELD automatically record the below bullet points following at each change of duty status in §395.24(b), to include engine power up/shut down, change in special driving category, a change of duty status if none has occurred in the last 60 minutes while in motion?
Date & Time
Does the ELD obtain and record the date and time (synchronized to Coordinated Universal Time (UCT) information automatically without allowing any external input or interference from a motor carrier, driver, or any other person?
- An ELD must convert and track date and time captured in UTC standard to the time standard in effect at driver’s home terminal, taking the daylight savings time changes into account by using the parameter “Time Zone Offset from UTC” as specified in section 7.41 of this appendix.
- The 24-hour period beginning time is specified by the motor carrier for that driver’s home terminal.
- The data element “Time Zone Offset from UTC” must be included in the “Driver’s Certification of Own Records” events.
CMV geographic location information
Does the ELD determine automatically, without allowing any external input or interference from a motor carrier, driver, or any other person, the position of the CMV in standard latitude/longitude coordinates as a “Geo-Location” with the accuracy and availability requirements below?
- Geo-location is the conversion of a position measurement in latitude/longitude coordinates into a description of the distance and direction to a recognizable nearby location name. Geo-location information is used on an ELD’s display or printout.
- For each change in duty status, the ELD must convert position information which indicates approximate distance and direction to an identifiable location corresponding to the name of a nearby city, town, or village, with a State abbreviation. (derived from a database that contains all cities, towns, and villages with a population of 5,000 or greater and listed in ANSI INCITS 446-2008 (R2013)
- An ELD’s viewable outputs (such as printouts or display) must feature geo-location information as place names in text format. (Examples: [2mi ESE IL Darien], [1mi SE TX Dallas], [11mi NNW IN West Lafayette].
- Accuracy (±1mile of absolute position during the course of a CMV’s operation)
- ±0.5 mile of absolute position of the CMV when an ELD measures a valid latitude/longitude coordinate value.
- Position information must be standard signed latitude and longitude values expressed as decimal degrees to hundreds of a degree precision.
- During personal use the precision requirement is reduced to tenths of a degree.
- Measurement
- The ELD acquire a valid position measurement at least once every 5 miles of driving only during ELD events as specified in section 4.5.1 of the Part 395 appendix.
What is the level of accuracy for commercial motor vehicle (CMV) location information recorded by an electronic logging device (ELD)?
During on-duty driving periods, the location accuracy is approximately within a 1-mile radius. When a driver operates a CMV for personal use, the position reporting accuracy would be approximately within a 10-mile radius
Will GPS-derived data for mileage be allowed as a substitute for data that cannot be readily obtained from a vehicle electronic control module (ECM)?
No, the ELD must be able to monitor engine operation to automatically capture required data. A GPS is not integrally synchronized with a vehicle’s engine, and cannot be a substitute for required ECM data to comply with the ELD rule.
Driver’s Entry of Location Information
An ELD must allow manual entry of a CMV’s location by the driver in text format in support of the driver edit requirements it must be available as an option to a driver only when prompted by the ELD. It provides ability for a driver to enter location information related to entry of missing records; provides ability to accommodate temporary positioning service interruptions or outage without setting positioning malfunctions.
- When the ELD had failed to acquire a valid position measurement within the most recent elapsed 5 miles of driving, but the ELD has not yet set a positioning compliance malfunction, the driver’s manual location entry is allowed. If the ELD event is due to a change in duty status for the driver, the ELD must prompt the driver to enter location manually.
- A manual location entry must show “M” in the latitude/longitude coordinates fields in ELD records.
Engine Hours
This element refers to the time the CMV’s engine is powered in decimal hours with 0.1 hr (6-minute) resolution; this parameter is the Total} Engine Hours, which refers to the aggregated time of a vehicle’s engine’s operation since its inception, and used in recording “engine power on” and “engine shut down” events, and for Elapsed Engine Hours, which refers to the elapsed time in the engine’s operation in the given ignition power on cycle, and used in the recording of all other events.
- Provides ability to identify gaps in the operation of a CMV, when the vehicle’s engine may be powered but the ELD may not; provides ability to cross check integrity of recorded data elements in events and prevent gaps in the recording of ELD.
Vehicle Miles
This data element is acquired from the engine ECM or a comparable source as allowed and refers to the distance traveled using the CMV in whole miles; which refers to the odometer reading and is used in recording “engine power on” and “engine shut down” events, and also for the accumulated miles in the given ignition power on cycle and is used in the recording of all other events.
- Does the ELD monitor and log both the vehicle miles and hours by the CMV during the ignition power on cycle and the total miles and hours over the course of CMV’s operation?
- Provides the ability to track distance traveled while operating the CMV in each duty status. Total miles traveled within a 24-hour period is a required field in §395.8.
Driver or Authenticated User Identification Data
Exempt Driver:
The ELD must allow a motor carrier to configure exempt use and must configured a driver’s profile to claim exemption from ELD use. (Avoids issues with unidentified driver data diagnostics errors)
Exempt drivers can drive CMVs equipped with ELDs and still use their exception. A motor carrier may configure an ELD to show the exception for drivers exempt from using the ELD, or use the ELD annotation to record the status.
Can a motor carrier set up a driver account as an “exempt driver” and have another account for the same driver as a regular driver account?
No. The ELD rule prohibits multiple driver accounts for one driver. The motor carrier must proactively change the driver’s status to and from exempt and non-exempt.
Unidentified Driver
If more than 30 minutes of driving in a 24-hour period show unidentified driver on the ELD, the ELD must detect and record an unidentified driving records event and the indicator must be turned on for all drivers logged in to that ELD for the current 24-hour period and the following 7 days.
An unidentified driving records data diagnostic event can be cleared by the ELD when driving time logged under the unidentified driver profile for the current 24-hour period and the previous 7 consecutive days drops to 15 minutes or less.
ELD without an authenticated driver logging in the system must automatically capture driving time and attribute such records to the “Unidentified Driver account,” until they are assigned to the true and correct owner
Monitoring Records Logged Under the Unidentified Driver Profile
When there are ELD records involving driving time logged on an ELD under the unidentified driver profile, the ELD must prompt the driver(s) logging in with a warning indicating the existence of new unassigned driving time.
- The ELD must provide the ability for the driver to review and either accepts the assignment of the unidentified driver records or indicate that these records are not attributable to the driver.
Driver’s Assumption of Unidentified Driver Logs
When a driver reviews and assumes ELD record(s) logged under the unidentified driver profile, the ELD must:
- Identify the ELD record(s) logged under the unidentified driver profile that will be reassigned to the driver and acquire driver input to populate missing elements of the log originally recorded under the unidentified driver profile, and construct the new event record(s) for the driver.
What must a driver do with unassigned driving time when he or she logs into the electronic logging device (ELD)?
A driver must review any unassigned driving time when he or she logs into the ELD. If the unassigned records do not belong to the driver, the driver must indicate that in the ELD record. If driving time logged under this unassigned account belongs to the driver, the driver must add that driving time to his or her own record.
What must a motor carrier do with unassigned driving records from an electronic logging device (ELD)?
A motor carrier must either explain why the time is unassigned or assign the time to the appropriate driver. The motor carrier must retain unidentified driving records for at least six months as a part of its hours of service (HOS) ELD records and make them available to authorized safety officials.
Vehicle Identification Data
- The vehicle identification number (VIN) for the power unit must be automatically obtained from the engine ECM and recorded if it is available on the vehicle via the vehicle databus.
- Mandatory for all ELDs linked to the engine ECM and when VIN is available from the engine ECM over the vehicle databus; otherwise optional. If optionally populated and source is not the engine ECM, precede VIN with the character “-” in records.
Driver’s Manual Entries
- An ELD must prompt the driver to input information into the ELD only when the CMV is stationary and driver’s duty status is not on-duty driving, except for Automatic Setting of Duty Status to On-Duty Not Driving. (5min no driving)
- The ELD must only allow the driver who is operating the CMV to change the driver’s duty status to another duty status if in driving status.
- An ELD must provide a means for a driver to manually enter information pertaining to the driver’s ELD records. If the motor carrier populates these fields automatically, the ELD must provide means for the driver to review such information and make corrections as necessary.
- CMV power unit number – Unique CMV identifier that the carrier uses in its normal course of business and includes on dispatch documents, or the license number and the licensing State of the power unit. Examples: [123], [00123], [BLUEKW123], [TX12345].
- Trailer number(s) – as specified above and must be updated each time hauled trailers change
- Shipping document number 39 – The shipping document number the motor carrier uses in their system and dispatch documents. Links ELD data to the shipping records Mandatory if a shipping number is used on motor carrier’s system.
Driver’s Annotation of Record
This is a textual note that must be allowed which is related to a record, update, or edit capturing the comment or annotation a driver or authorized support personnel may input to the ELD. This provides ability for a driver to offer explanations to records, selections, edits, or entries.
- Optional in general; Mandatory if prompted by ELD. (Ex. Personal Conveyance – Driving to Restaurant in bobtail mode, forgot to switch to SB)
- The ELD must require annotations to be 4 characters or longer, including embedded spaces if driver annotation is required and driver is prompted by the ELD.
- If a driver edits or annotates an ELD record or enters missing information, the act must not overwrite the original record.
- Driver edits must be accompanied by an annotation. The ELD must prompt the driver to annotate edits.
Can a driver annotate the electronic logging device (ELD) record?
Yes. A driver can use annotations to indicate the beginning and end of a period of authorized personal commercial vehicle use, or yard moves, as well as other special driving categories, such as adverse driving conditions (49 CFR 395.1(b)) or oilfield operations (49 CFR 395.1(d)).
How can a driver record their on-duty not driving status, such as working in a warehouse, on an ELD, prior to operating a commercial motor vehicle equipped with an ELD?
All of the driver’s hours of service must be accounted for when subject to the HOS rules. Prior to operating a commercial motor vehicle equipped with an ELD, the driver can manually add any on-duty not driving time accrued prior to.
Are drivers allowed to edit their records of duty status (RODS) using the electronic logging device (ELD) back office support systems once they leave the commercial motor vehicle (CMV)?
Yes. Drivers may edit their RODS using ELD back office support systems. While these edits or corrections are allowed to ensure an accurate record of the driver’s duty status, the electronic record must retain what was originally recorded, as well as the date, time, and identity of the individual entering the corrections or edits.
Driver Edit Limitations
An ELD must not allow automatically recorded driving time to be shortened or the ELD username associated with an ELD record to be edited or reassigned, except under the following circumstances:
- ELD events recorded under the “Unidentified Driver” profile may be edited and assigned to the driver associated with the record; and
- In the case of team drivers, the driver account associated with the driving time records may be edited and reassigned between the team drivers if there was a mistake resulting in a mismatch between the actual driver and the driver recorded by the ELD and if both team drivers were respectively indicated in each other’s records as a co-driver. The ELD must require each co-driver to confirm the change for the corrective action to take effect.
- An ELD must retain the original records even when allowed edits and entries are made over a driver’s ELD records.4.4.4.2
Motor Carrier’s Post-Review Electronic Edit Requests
- An ELD may allow the carrier to screen, review, and request corrective edits to the driver’s certified and submitted records through the ELD system electronically. If through the ELD it must support functions for the driver to see and review the requested edits.
- Edits requested by anyone or any system other than the driver must require the driver’s electronic confirmation or rejection.
Driver’s Actions Over Motor Carrier Edit Suggestions
If edits are requested by the motor carrier, the ELD must allow the driver to review the requested edits and indicate on the ELD whether the driver confirms or rejects the requested edit(s).
- If the driver approves the motor carrier’s edit suggestion the ELD must set the event record status of the ELD record(s) identified (inactive-changed).
- If the driver disapproves the motor carrier’s edit(s) suggestion, the ELD must set the “event record status” of the ELD record(s) to (inactive-change rejected).
Can a user edit or change driving time that has been recorded by an electronic logging device (ELD) to non-driving time?
No. An ELD automatically records all of the time that a CMV is in motion as driving time that cannot be edited or changed to non-driving time.
Who is responsible for the integrity of records of duty status in regards to the editing and certification rights of drivers and motor carriers?
Although the ELD reflects the driver’s RODS, the driver and carrier share responsibility for the integrity of the records. The driver certification is intended, in part, to protect drivers from unilateral changes. However, if the driver is unavailable or unwilling to recertify the record, the carrier’s proposed edit and annotation would remain part of the record.
Are the original electronic logging device (ELD) records retained after edits are made, and accessible to drivers?
Yes. The original ELD records are retained even when allowed edits and annotations are made. If the driver cannot independently access the records from the ELD, the motor carrier must provide access on request. However, the right to access is limited to a six-month period, consistent with the period during which a motor carrier must retain drivers’ records of duty status (RODS).
What procedure should be followed if multiple, incompatible electronic logging devices (ELDs) are used to record a driver’s record of duty status (RODS)?
The motor carrier and the driver are responsible for ensuring that all of the RODS information required by the HOS rules is available for review by authorized safety officials at the roadside. If the driver uses multiple ELDs that are not compatible (e.g., the data file from one system cannot be uploaded into the other system), the driver must either manually enter the missing duty status information or provide a printout from the other system(s) so that an accurate accounting of the duty status for the current and previous seven days is available for the authorized safety official.
What procedure should be followed if an electronic logging device (ELD) is replaced or reset?
For a reset or replaced ELD, the ELD rule requires data or documents showing the driver’s records of duty status (RODS) history in the vehicle. This data would include the driver’s past seven days of RODS, either loaded into the “new” ELD or in paper format to be provided at roadside.
When a motor carrier discovers a driver in a team driving operation failed to log in and his or her activities were assigned to the co-driver, can the motor carrier reassign the generated data?
For team drivers, the driver account associated with the driving time records may be edited and reassigned between the team drivers, if there was a mistake resulting in a mismatch between the actual driver and the driver recorded by the ELD, and if both team drivers were indicated in one another’s records as a co-driver. Each co-driver must confirm the change for the corrective action to take effect.
Driver Certification
At each instance when a driver certifies or re-certifies that the driver’s records for a given 24-hour period are true and correct, the ELD must record the event. The ELD must associate the record with the driver, the vehicle, the motor carrier, and the shipping document number and must include the following data elements:
- Event Sequence ID Number -identifier assigned to each required ELD event
- Event Type – type of the event record
- Event Code – further specifies nature of the change indicated in “Event Type”; this parameter indicates the new status after the change.
- Time Zone Offset from UTC
- Event Date & and Date of the certified record.
- Event Time
Automatic Setting of Duty Status to – Driving
Is the ELD’s set speed threshold for determination of the in-motion state, configured not to be greater than 5 miles per hour?
An ELD must automatically record driving time when the vehicle is in motion by setting duty status to driving for the driver unless, before the vehicle is in motion, the driver:
- Sets the duty status to off-duty and indicates personal use of CMV, in which case duty status must remain off-duty until driver’s indication of the driving condition ends; or
- Sets the duty status to on-duty not driving and indicates yard moves, in which case duty status must remain on-duty not driving until driver’s indication of the driving condition ends.
The vehicle must maintain zero (0) miles per hour speed to be considered stationary/stopped for purposes of information entry into an ELD.
An ELD must allow an authenticated co-driver who is not driving, but who has logged into the ELD prior to the vehicle being in motion, to make entries over his or her own records when the vehicle is in motion. The ELD must not allow co-drivers to switch driving roles when the vehicle is in motion.
Automatic Setting of Duty Status to – On-Duty Not Driving
When the duty status is set to driving, and the CMV has not been in-motion for 5 consecutive minutes, the ELD must prompt the driver to confirm continued driving status or enter the proper duty status. If the driver does not respond to the ELD prompt within 1-minute after receiving the prompt, the ELD must automatically switch the duty status to on-duty not driving. The time thresholds for purposes of this section must not be configurable.
Other Automatic Duty-Status Setting Actions Prohibited
An ELD must not feature any other automatic records of duty setting mechanism other than the two mentioned above.
Can an electronic logging device (ELD) record be set to record minimum duty status durations, such as 15 minutes?
No. The ELD will capture all entered duty statuses, and there is no minimum amount of time that these statuses must or should be engaged. While longstanding industry and enforcement practices may have relied upon minimum intervals of 15 minutes in handwritten records of duty status (RODS), an ELD provides a more accurate accounting of drivers’ time. This should not be construed to indicate that the activities electronically recorded as less than 15 minutes are suspect, only that the time actually required to complete the task may be less that what had been traditionally noted in the paper RODS
Can an ELD use geofencing to automatically change a driver’s duty status to Yard Move?
No. While this was permitted for AOBRDs, this is not permitted under the ELD rule. The device can use geofencing to prompt the driver to change their duty status, but it cannot change the duty status automatically.
Tracking Non-Authenticated operation
The ELD must associate the non-authenticated operation of a commercial motor vehicle with a single account labeled “Unidentified Driver” as soon as the vehicle is in motion, if no driver has logged into the ELD.
Special Driving Categories
An ELD must provide the means for a driver to indicate the beginning and end of a period when the driver may use the CMV for authorized personal use or for performing yard moves. The ELD must acquire this status in a standard format from the category list in Table 2 of this appendix. This list must be supported independent of the duty status categories described in section 4.3.2.2.1 of this appendix.
- The ELD must allow a driver to select only categories that a motor carrier enables by configuration for that driver, as described in section 4.3.3.1.1 of this appendix.
- An ELD must only allow one category to be selected at any given time and use the latest selection by the driver.
- The ELD must prompt the driver to enter an annotation upon selection of personal use or yard move and record the driver’s entry.
- A driver’s indication of special driving situation must reset to none if the ELD or CMV’s engine goes through a power off cycle (ELD or CMV’s engine turns off and then on) except if the driver has indicated authorized personal use of CMV. If the driver has indicated authorized personal use of the CMV, the ELD must require confirmation of continuation of the authorized personal use of CMV condition by the driver. If not confirmed by the driver and the vehicle is in motion, the ELD must default to none.
If the motor carrier configured the driver user account to authorize a special driving category, then the graph-grid will overlay periods using a different style line (such as dashed, dotted line, or shading) in accordance with section 4.8.1.3(c)(1) of the ELD Functional Specifications. The appropriate abbreviation must also be indicated on the graph-grid.
If the motor carrier does not configure the driver user account to authorize special driving categories, then the driver must annotate the beginning and end of the applicable special driving category.
Driver’s Certification of Records
An ELD must include a function whereby a driver can certify the driver’s records at the end of a 24-hour period.
- This function must display a statement that reads “I hereby certify that my data entries and my record of duty status for this 24-hour period are true and correct.”
- It must prompt the driver to select “Agree” or “Not ready.” It must record the driver’s affirmative selection of “Agree” as an event.
- An ELD must only allow the authenticated driver to certify records associated with that driver.
- If any edits are necessary after the driver certifies the records for a given 24-hour period, the ELD must require and prompt the driver to re-certify the updated records.
- If there are any past records on the ELD (excluding the current 24-hour period) that require certification or re-certification by the driver, the ELD must indicate the required driver action on the ELD’s display and prompt the driver to take the necessary action during the login and logout processes.
When should a driver certify his or her record of duty status (RODS) on the electronic logging device (ELD) to avoid malfunction codes?
FMCSA recommends that drivers first certify their RODS before logging off the ELDs and then shutting down their CMVs’ engines. If drivers don’t follow this recommendation, malfunction codes may occur, such as indicating unaccounted odometer changes and suspicious driving activity.
ELD Malfunction Indicator
ELD malfunctions affect the integrity of the device and its compliance; therefore, active malfunctions must be indicated to all drivers who may use that ELD. An ELD must provide a recognizable visual indicator, and may provide an audible signal, to the operator as to its malfunction status.
The visual signal must be visible to the driver when the driver is seated in the normal driving position and must be clearly illuminated when there is an active malfunction on the ELD. It must continuously communicate to the driver when the ELD is powered.
ELD Data Diagnostic Status Indicator
This is an indicator identifying whether the used ELD unit has an active data diagnostic event set for the authenticated driver at the time of event recording. It documents the snapshot of ELD’s data diagnostic status at the time of an event recording.
The ELD must only indicate the active data diagnostics status applicable to the driver logged into the ELD. An ELD must provide a recognizable visual indicator, and may provide an audible signal, to the driver as to its data diagnostics status.
An ELD must display a single visual data diagnostics indicator, separate from the visual malfunction indicator described above, to communicate visually the existence of active data diagnostics events for the applicable driver. It also must be visible to the driver when the driver is seated in the normal driving position.
Driver’s ELD Volume Control
If the ELD outputs an audible signal and a driver selects the sleeper-berth status, and no co-driver has logged into the ELD as on-duty driving the ELD must either allow the driver to mute or turn off the ELD’s audible output, or automatically mute or turn off the ELD’s audible output. This also applies if ELD is in combination with another device or other hardware or software technology that is not separate from the ELD.
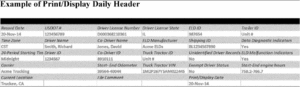
Printout or Display
The ELD must be able to either print or display.
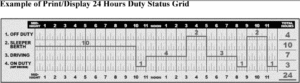
- The printout and display must show a graph-grid consistent with §395.8(g) showing each change of duty status. The graph-grid must overlay periods of driver’s indications of authorized personal use of CMV and yard moves using a different style line (such as dashed or dotted line) or shading. The appropriate abbreviation must also be indicated on the graph-grid.
- Print paper must be able to accommodate the graph grid specifications as listed in “Information To Be Shown on the Printout and Display at Roadside” below:
- On the printout, the graph-grid for each day’s RODS must be at least 6 inches by 1.5 inches in size.
Information To Be Shown on the Printout and Display at Roadside
The printout and display must show reports for the inspected driver’s profile and the unidentified driver profile separately. If there are no unidentified driver records existing on the ELD for the current 24-hour period and for any of the previous 7 consecutive days, an ELD does not need to print or display unidentified driver records for the authorized safety official. Otherwise, both reports must be printed or displayed and provided to the authorized safety official.
- The printout and display must show the following information for the current 24-hour period and each of the previous 7 consecutive days:
- Date: 24-hour Starting Time, Time Zone Offset from UTC
- Carrier: Carrier’s USDOT number, Carrier Name
- Driver Name: Last Name, First Name
- Driver ID: ELD username
- Driver License Issuing State
- Driver License Number
- Co-Driver: Last Name, First Name
- Co-Driver ID: ELD username
- Current Odometer: Current Total Vehicle Miles
- Current Engine Hours: Current Total Engine Hours
- ELD ID: ELD Registration ID
- ELD Provider:
- Truck Tractor ID: Power Unit Number
- Truck Tractor VIN:
- Shipping ID: Shipping Document Number
- Current Location: Current Geo-location
- Unidentified Driving Records: Current Data Diagnostic Event Indicator Status for “Unidentified driving records data diagnostic” event
- Exempt Driver Status: Exempt Driver Configuration
- ELD Malfunction Indicators: Status and Malfunction Description
- Driver’s Data Diagnostic Status: Status and Diagnostic Description
- Date: Of Printout or Display
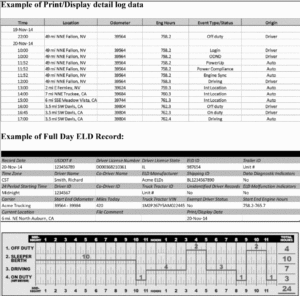
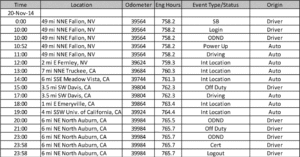
- Change of Duty Status, Intervening Interval Records and Change in Driver’s Indication of Special Driving Conditions:
- Event Record Status, Record Origin, Type, Date, Time, Accumulated Vehicle Miles, Elapsed Engine Hours, Geo-Location#, Comment/Annotation
- Event Sequence ID Number, Record Status, Record Origin, Type, Code, Date, Time, Accumulated Vehicle Miles, Elapsed Engine Hours, Geo-Location#, Comment/Annotation
- 24 Hours – Print & Display Graph Grid
- Total hours – in working day so far
- Off duty – Total Hours logged in Off-duty status
- Sleeper Berth – Total Hours logged in Sleeper berth status
- Driving – Total Hours logged in Driving status
- On duty not driving – Total Hours logged in on-duty not driving status
- Miles Today – Vehicle Miles Driven Today
For Each Row of Driver’s Record Certification Events:
- Time: Event Time
- Location: Geo-Location#
- Odometer: Total Vehicle Miles
- Engine Hours: Total Engine Hours
- Event: Date of the certified record
- Origin: Driver
- Comment: Event Comment/Annotation
For Each Row of Malfunctions and Data Diagnostic Event
- Time: Event Time
- Location: Geo-Location#
- Odometer: Total Vehicle Miles
- Engine Hours: Total Engine Hours
- Event: Event Type
- Origin: Event Record Origin
- Comment: Event Comment/Annotation
For Each Row of ELD Login/Logout Events
- Time: Event Time
- Location: Geo-Location#
- Odometer: Total Vehicle Miles
- Engine Hours: Total Engine Hours
- Event: Event Type
- Origin: ELD username
- Comment: Event Comment/Annotation
For Each Row of CMV Engine Power up/Shut Down Events
- Time: Time (24 hours)
- Location: Geo-Location#
- Odometer: Total Vehicle Miles
- Engine Hours: Total Engine Hours
- Event: Event Type
- Origin: Auto
- Comment/Annotation
What is the difference between “paper records of duty status (RODS)” and printouts of RODS from electronic logging devices (ELDs)?
“Paper RODS” means RODS that are not kept on an ELD, but that are either recorded manually (in accordance with 49 CFR 395.8(f)) or on a computer not synchronized with the vehicle or that is otherwise not qualified to be an ELD.
Printouts of RODS from ELDs are the reports that ELDs must be able to generate upon request from an authorized safety official the detail as shown above. (4.8.1 of the ELD rule).
File Output
Does the ELD generates a standard data file output and allows the transfer to an authorized safety official upon request?
Driver’s Entry of an Output File Comment
An ELD must accommodate the entry of an output file comment up to 60 characters long. If an authorized safety official provides a key phrase or code during an inspection to be included in the output file comment, which may be used to link the requested data to an inspection, inquiry, or other enforcement action; if provided to the driver by an authorized safety official, it must be entered into the ELD and included in the exchanged dataset as specified. It must be entered and embedded in the electronic ELD records in the exchanged dataset as specified in section 4.8.2.1.1 of this appendix. The default value for the output file comment must be blank. This output file comment must be used only for the creation of the related data files for the intended time, place, and ELD user.
If more than one ELD unit is used to record a driver’s records within a motor carrier’s operation, the ELD in the vehicle the driver is operating most recently must be able to produce a complete ELD report for that driver, on demand, for the current 24-hour period and the previous 7 consecutive days.
Data Transfer During Roadside Safety Inspections
On demand during a roadside safety inspection, an ELD must produce records for the current 24-hour period and the previous 7 consecutive days in electronic format, in the standard data format.
Driver’s (Single-Step) Data Transfer Initiation Input
- An ELD must provide a standardized single-step driver interface for compilation of driver’s ELD records and initiation of the data transfer to authorized safety officials when requested during a roadside inspection.
- The ELD must input the data transfer request from the driver, require confirmation, present and request selection of the supported data transfer options by the ELD, and prompt for entry of the output file comment as specified in section 4.3.2.5 of this appendix. Upon confirmation, the ELD must generate the compliant output file and perform the data transfer.
- The supported single-step data transfer initiation mechanism (such as a switch or an icon on a touch-screen display) must be clearly marked and visible to the driver when the vehicle is stopped.
When a driver uses the single-step driver interface, as indicated above, to initiate the ELD to compile and transfer the driver’s ELD records to authorized safety officials, the ELD must transfer the generated ELD data output to the computing environment used by authorized safety officials.
To meet roadside electronic data transfer requirements, an ELD must provide an ELD record for the current 24-hour period and the previous 7 consecutive days on a display or on a printout and do at least one of two following:
Web Services as specified below (not necessarily wirelessly), 4.10.1.1
- Option 1—Telematics transfer methods. Transfer the electronic data using both:
- Wireless Web services, and Email, or
- Option 2—Local transfer methods. Transfer the electronic data using both:
- USB2 (incorporated by reference, see §395.38), and Bluetooth
An authorized safety official will specify which certified transfer mechanism between the two that the official will use.
ELDs must transmit ELD records electronically in accordance with the ELD Output File Standard file format and must be capable of a one-way transfer of these records to authorized safety officials upon request as specified above. (Only way to verify is during an actual inspections and transfer)
To ensure that law enforcement is always able to receive the hours of service (HOS) data during a roadside inspection, a driver must be able to provide either the display or a printout when an authorized safety official requests a physical display of the information.
FMCSA will not retain any ELD data unless there is a violation.
Record Backup and Security
Does the carrier maintain a back-up copy of the ELD records on a device separate from that on which the original data are stored for 6 months?
A motor carrier must retain ELD record of duty status (RODS) data and back-up data for six months. The back-up copy of ELD records must be maintained on a device separate from that where original data are stored. Additionally, a motor carrier must retain a driver’s ELD records in a manner that protects driver privacy.
Motor Carrier Requirements for Repair, Replacement, or Service
If a motor carrier receives or discovers information concerning the malfunction of an ELD, the motor carrier must take actions to correct the malfunction of the ELD within 8 days of discovery of the condition or a driver’s notification to the motor carrier, whichever occurs first.
Multiple Motor Carrier Employers
If a driver is employed by multiple motor carriers that are using ELDs, the driver can present their record of duty status for the previous 7 days during a roadside inspection by the following methods;
- The driver can either,
- (1) print out their hours-of-service from the other motor carrier,
- (2) if operating with compatible devices the ELD data can be transferred between the motor carriers with the driver’s approval, or
- (3) manually add the hours of service while operating for that motor carrier into the current ELD using the editing and annotation functions of the ELD.
New Motor Carrier Employment
A driver who is starting to work for a new motor carrier may present their prior 7 days’ records of duty status to the new carrier by obtaining from the driver a signed statement giving the total time on duty during the immediately preceding 7 days and the time at which the driver was last relieved from duty prior to beginning work for the motor carriers.” In the alternative, the driver may present copies of the prior 7 days’ records of duty status or a print-out of the prior 7 days from the prior carrier’s ELD system.
Operations in Canada
The ELD provider may tailor the device to its customers’ needs/operations to assist them in accurately monitoring drivers’ hours of service compliance in accordance with the hours of service standards of the country operated in, such as cross-border operations.
What procedure should be followed if multiple, compatible electronic logging devices (ELDs) are used to record a driver’s record of duty status (RODS) within a motor carrier’s operation?
If multiple, compatible ELDs are used to record a driver’s RODS within a motor carrier’s operation, the ELD in the vehicle the driver is operating must be able to produce a complete ELD report for that driver, on demand, for the current 24-hour period and the previous 7 consecutive days.
Can an electronic logging device (ELD) have a feature to warn drivers about approaching hours of service (HOS) limits?
Yes. FMCSA allows, but does not require, warning or notification to drivers when they are nearing their HOS limits
May an ELD device be used to track mileage for tax reporting purposes?
The device manufacturer may offer that service as part of a fleet management package but mileage tracking for tax reporting purposes is not part of the ELD data established in Part 395.
END
New guidance for commercial vehicle inspectors distinguishes between more traditional logbook violations and tampered ELD data that can result in mandatory 10-hour out-of-service orders.
Deborah Lockridge
The Commercial Vehicle Safety Alliance issued new inspection guidance aimed at cracking down on falsified records of duty status (RODS, more commonly known as driver logs) and electronic logging device tampering.
The bulletin, effective April 1, outlines how inspectors should handle altered logs of driver hours of service.
The move comes ahead of CVSA’s annual Roadcheck in May (where ELDs are a focus this year) and as the Federal Motor Carrier Safety Administration has been taking steps to crack down on fraudulent ELDs.
More traditional false log violations, such as misuse of personal conveyance or failure to log into the ELD, are typically easier for inspectors to detect.
If a driver is over hours at the time of inspection, CVSA explains, inspectors can usually determine how much rest was actually taken and whether the driver should be placed out of service.
ELD Tampering
More concerning, CVSA says inspectors are encountering RODS (records of duty status) that have been reengineered, reprogrammed or otherwise tampered with, and the bulk of the four-page guidance document is devoted to this topic.
These violations are harder for inspectors to identify and harder to determine whether drivers should be placed out of service.
CVSA gives an example of fraudulent use of driver credentials. A motor carrier created a fictitious ELD account using the same driver’s name but slightly altered credentials — such as changing a letter from uppercase to lowercase and modifying one digit in the CDL number.
The fraudulent use of driver credentials is an unauthorized alteration of the ELD and therefore considered tampering. This example shows a motor carrier creating a fictitious driver ELD account.
The driver alternated between the two accounts to continue driving after exceeding hours-of-service limits.
In another example cited by CVSA, a driver was shown as off duty in Tolleson, Arizona, at 9 p.m. on Aug. 10, 2024. However, a fuel receipt placed the driver in Strafford, Missouri, on Aug. 11 — more than 1,300 miles away.
Further review showed the RODS had been shifted back three days, concealing nearly 21 hours of driving time.
When Should Drivers Be Placed Out of Service for ELD Violations?
CVSA says the goal in enforcing ELD violations is to only place drivers OOS who pose an imminent hazard.
When it is possible for the inspector to determine when the falsification occurred, and the driver is not over hours at the time of inspection, CVSA tells inspectors to cite drivers under § 395.8(e)(1) and allow the driver to proceed.
How a Fake Co-Driver Led to a Fatal Crash
If this is the case and a driver is over the HOS limits at the time of inspection, however, the driver should be placed out of service until he or she is eligible to drive again under hours-of-service rules.
For drivers whose RODS have been reengineered, reprogrammed or tampered with, and the ELD does not accurately record or retain required data, inspectors face a tougher job.
These altered logs may show no indication in the event details that any changes were made.
In such cases, inspectors must compare supporting documents, such as fuel receipts, to what’s in the ELD record. Because the actual time, duration, and location of rest breaks cannot be determined, enforcement becomes more serious.
If it’s not possible for the inspector to determine when driving occurred, CVSA says, the inspector should cite a § 395.8(e)(2) violation and place the driver out of service for 10 consecutive hours.
During a roadside inspection, an authorized safety official may request the electronic logging device (ELD) output file to verify compliance with Hours of Service (HOS) regulations. The driver must be able to transfer this data electronically to the officer, typically via web services or email, for the current 24-hour period and the previous 7 consecutive days.
Key Requirements for ELD Output File Submission
- Data Contents: The output file is a standardized, raw data file containing HOS data, including duty status changes (on-duty, off-duty, driving), vehicle miles, engine hours, location, and any ELD malfunctions or diagnostic events.
- Transfer Methods: Drivers must know how to send the file via the specific method required by the officer (usually web services or email to the eRODS system).
- Inspection Procedure: If the file transfer fails, the driver must be able to display the required 8 days of logs directly on the ELD screen.
- Mandatory Documentation: Drivers must have an ELD information packet in the vehicle, which includes an instruction sheet on how to transfer this data.)
FMCSA Open Data File Explained
An FMCSA open data file is a publicly available dataset from the Federal Motor Carrier Safety Administration (FMCSA) that contains regulated entity and safety performance information, made available at no cost through the U.S. Department of Transportation’s Open Data Portal (DataHub)
What It Includes
FMCSA open data files cover a range of carrier and safety-related information, organized into categories such as:
- Entities with a USDOT Number – basic registration data for carriers, brokers, and freight forwarders.
- Entities with Operating Authority – details on active, inactive, or pending authorities.
- FMCSA Safety Measurement System (SMS) Data – percentile safety scores, inspection counts, crash data, and out-of-service rates for all active motor carriers.
- New Entrant Safety Assurance Program – safety data for new carriers.
- Out of Service (OOS) Orders – records of carriers placed out of service
Each file comes with a data dictionary that defines the fields, data types, and meanings, so users can interpret the information correctly
How It’s Accessed
You can download these files directly from the DOT Open Data Portal at data.transportation.gov or via the FMCSA Open Data Program page. The portal also provides API access for developers.
Purpose and Benefits
The FMCSA Open Data Program aims to:
- Increase public participation in government.
- Support economic development.
- Provide decision-making tools for both public and private sectors
Example Use Cases
- Market research – analyze carrier presence and safety performance in a region.
- Risk assessment – identify carriers with high safety scores or frequent violations.
- Regulatory monitoring – track compliance and out-of-service orders.
- Industry analysis – study fleet sizes, cargo types, and authority types.
In short: An FMCSA open data file is a downloadable, structured dataset of FMCSA-regulated carrier and safety information, designed for transparency, research, and operational use.
What is a standard Eld output file?
An ELD generates a standard data file output and transfers it to an authorized safety official upon request. (e) This appendix specifies minimally required data elements that must be part of an event record such that a standard ELD output file can be produced by all compliant ELDs.
ELD File Validator
Manufacturers must ensure their ELD output file conforms to the technical specifications in the ELD rule.
What is the ELD filename standard?
If the ELD output is saved in a file for transfer or maintenance purposes, it must follow the 25 character-long filename standard. The first five position characters of the filename must correspond to the first five letters of the last name of the driver for whom the file is compiled.
Use the tool below to test your file. Using the File Validator is not a mandatory step of the self-certification process. ELD providers are encouraged to use this tool to help the self-certification process go as smoothly as possible.
Instructions
- Click on “Browse,” to select the file you want to test.
- Click “Check.”
- Review results.
- Resolve any issues.
- Repeat as necessary until validator confirms no issues.
Tips
Start Small
For your first try, use a simple output file with two or three events. This will help identify any basic issues that need resolving before more complex problems can be identified.
Check Often
The File Validator may not catch all issues on an initial run. Be sure to run your file through the validator after issues have been resolved, as this may uncover additional issues.
Note: The File Validator will only validate the technical specifications of an ELD file, not the file’s content. Compliance with FMCSA’s hours-of-service regulations will be determined by enforcement personnel’s interpretation of the data after it has successfully transferred through FMCSA’s systems.
Upload your file
vider Account.
Request a user account
Download eRODS Software
The Electronic Record of Duty Status (eRODS) software is used by safety officials to locate, open, and review output files transferred from a compliant ELD.
If you have an ELD file, you may use the web-based version of eRODS (Web eRODS) to see how the ELD file appears to safety officials in eRODS. Web eRODS does not display potential hours of service violations unless the user is a logged-in safety official.
You may also download the desktop version of eRODS (Desktop eRODS) to your computer. If you have an ELD file, you may use Desktop eRODS to see how the eRODS software identifies and displays potential hours of service violations.
Understanding the ELD Output File
An ELD output file is a standardized data export (usually in CSV or JSON format) that contains a driver’s Record of Duty Status (RODS), GPS location data, event timestamps, and system logs. Safety officials use tools like FMCSA’s eRODS to review these files for inconsistencies.
Steps to Detect False or Tampered Entries
- Load the File into a Validator
- Use the official FMCSA ELD File Validator (link here) or Web eRODS.
- This will parse the file and flag formatting errors, missing data, or suspicious event sequences.
- Check for Time & Location Mismatches
- Compare event timestamps with GPS coordinates.
- Large jumps in location without enough driving time.
- Driving events recorded when the vehicle is stationary.
- Gaps in GPS data during active driving periods.
- Look for Unusual Event Patterns
- Frequent manual driving status changes (e.g., switching from “Driving” to “Off Duty” mid-trip).
- Multiple unassigned driving segments that are later reassigned to a driver.
- Sudden engine power cycles that reset the log.
- Cross-Verify with External Data
- Compare ELD data with fuel receipts, toll records, or dispatch logs.
- If the ELD shows “Off Duty” but there’s a fuel purchase hundreds of miles away, that’s suspicious.
- Check for Tampering Indicators
- Missing or altered malfunction/error codes.
- Repeated data diagnostic events that could indicate attempts to bypass tracking.
- Inconsistent odometer readings.
False entries often leave a digital fingerprint — small inconsistencies in time, distance, or event sequencing. Automated tools like eRODS highlight these, but manual review is still essential for context.
If you want, I can create a simple checklist you can use every time you review an ELD output file so you can spot falsifications faster. Would you like me to prepare that?
The lease model, the labor pipeline, the insurance game, and why the growth formula always ends in dead bodies
Rob Carpenter
Four Amish men from Bryant, Indiana, are dead because a system designed to keep dangerous operators off the road has been reverse-engineered into a growth engine for the people it was supposed to stop.
The Sam Express network. Super Ego Holding. The dozens of operations that don’t have names you’d recognize yet but are running the same playbook right now in Chicago, Houston, Los Angeles, and every other metro area with a critical mass of immigrant labor and a Penske or Ryder dealership within driving distance.
These aren’t anomalies. They’re a business model.
I’ve spent the last several weeks documenting the Sam Express chameleon carrier network following the Feb. 3 crash in Jay County, Indiana, that killed Henry Eicher, 50, his sons Menno, 25, and Paul, 19, and family friend Simon Girod, 23. Secretary Duffy has confirmed the federal investigation. FMCSA went on-terminal. The scope is expanding.
This piece isn’t about Sam Express specifically. It’s about how many of them build their empires. Because until the industry understands the growth formula, we will continue to watch the same playbook produce the same body count, carrier after carrier, year after year.
Step 1: The Authority
It starts with a DOT number and motor carrier authority. That’s the license to operate.
Getting one is remarkably easy. File an OP-1 application with FMCSA. Pay a $300 filing fee. Obtain a process agent (BOC-3) in every state. File proof of insurance. Wait approximately three to four weeks. You’re a trucking company.
There is no safety audit at the gate. There is no site visit. There is no verification that you have trucks, drivers, a terminal, maintenance capabilities, or any operational infrastructure whatsoever. FMCSA’s new-entrant safety audit doesn’t occur until 12 to 18 months after the authority is granted, and historically, the agency has struggled to complete even those within the regulatory timeframe.
The ARCHI program, Application Review and Chameleon Identification, is supposed to screen new applicants by matching registration data against existing carriers, looking for shared addresses, phone numbers, officer names, email addresses, and VINs. It was established under Congressional authority and has reportedly been operating for 13 years. In 2021 alone, FMCSA granted 109,340 new carrier authorities, an 84 percent increase from the prior year. If just one percent have chameleon characteristics, that’s over 1,100 potentially dangerous carriers entering the system annually.
The bad actors know the math. Register multiple authorities like burner phones. Use them until they accumulate too many violations. Shut that one down. Activate the next one. The equipment, the drivers, the dispatch operation, the back office, none of it changes. Just the name on the door.
In the Sam Express network, we documented authorities registered one day apart that shared officers, terminal addresses, VINs, and the same stylized mountain logo on every truck, regardless of the DOT number under which it was registered. At an event in Orlando, a representative told attendees the operation had 500 trucks under a holding group. FMCSA data showed that individual authorities were far smaller. The holding group doesn’t exist in any corporate filing we’ve found. One operation. Multiple authorities. Presenting as unified to brokers. Presenting as separate to regulators.
Step 2: The Equipment
You don’t buy trucks. You lease them.
This is the financial engine that makes the entire model work, and it’s important to understand why.
Purchasing a new Class 8 tractor outright costs $150,000 to $200,000. That requires capital, creditworthiness, and a lender willing to underwrite the risk. Legitimate carriers build equity in their fleets. They have assets that may be seized pursuant to a judgment. They have something to lose.
Leasing eliminates all of that. A lease-purchase program through a manufacturer or dealer, or a full-service lease through companies such as Penske, Ryder, or other specialty lessors, places a truck on the road with minimal upfront capital. Some programs require as little as $1,000 down.
The real play isn’t the carrier leasing trucks from a dealer. It’s the carrier leasing trucks to drivers.
The carrier acquires equipment through whatever financing mechanism is available. Then the carrier offers that equipment to drivers under a “lease-purchase” arrangement. The driver makes weekly payments, typically deducted from their settlement. The driver is responsible for fuel, maintenance, tolls, and in many cases, insurance. The driver is classified as an independent contractor, which means the carrier doesn’t pay employment taxes, workers’ compensation, or benefits.
On paper, the driver is an “owner-operator” building equity toward truck ownership. In practice, the driver is absorbing nearly all operational costs while the carrier retains control of dispatch, load selection, rate negotiation, and the financial infrastructure.
The federal Truth in Leasing Act, 49 U.S.C. § 14102, requires carriers to provide transparent lease agreements and honest accounting. The Super Ego Holding class action lawsuit, filed in August 2022 in the Northern District of Illinois and now involving potentially 10,000 to 20,000 plaintiffs, alleges the company “fraudulently altered load confirmation documents to pay plaintiffs less than the rates specified in their work contracts.” The complaint alleges drivers were promised 88 percent of gross revenue but received falsified rate confirmations showing lower amounts. Drivers were overcharged for fuel. They paid for insurance that was voidable because they were operating under a different authority than the one listed on the policy. The companies operated as “alter egos,” with drivers being assigned loads for entities other than the company with which they had signed their lease.
The Super Ego network includes Kordun Express, Floyd Inc., Rocket Expediting, Haidar Dawood LLC, Trytime Transport, Windy City National Trans, Jordan Holdings d/b/a JHI Transport, and Twin Carrier. Sound familiar? Multiple carrier names. One operation. Drivers shuffled between authorities.
A federal civil complaint in the Sam Express orbit, Tsybikov v. Dovgal, describes a nearly identical scheme: 88 percent revenue promises with falsified rate confirmations, $14,000 in fuel deductions exceeding what was physically possible for the miles driven, a 12 percent dispatch fee for services never independently provided, and $250 per pay period for insurance policies that were voidable. When a driver was involved in a safety incident under one authority, the complaint alleges, they were simply transferred to a different authority, resetting the safety record.
The economics are elegant in their ruthlessness. The carrier has no capital expenditure because the equipment is leased. The carrier has minimal operating expenses because the drivers are absorbing fuel, maintenance, insurance, and tolls. The carrier’s revenue is the spread between what the broker pays for the load and what the driver actually receives, amplified by the deductions the carrier takes off the top before the driver sees a penny.
More trucks equals more cash flow. More drivers equals more deductions. The growth incentive points in one direction: scale as fast as possible, acquire as much equipment as possible, put as many drivers in seats as possible, and extract maximum revenue from every mile while the people doing the actual driving absorb the cost of doing business.
Step 3: The Labor
You don’t hire experienced, qualified, well-compensated drivers. You can’t afford to. The model doesn’t work with CDL holders who understand their market value, know their rights under the Truth in Leasing Act, and will walk when the settlement statements don’t add up.
The model works with people who have limited options.
Three populations are disproportionately targeted.
Foreign nationals. Nearly 19 percent of American truck drivers are foreign-born, according to census data, and the vast majority are hardworking professionals who keep the supply chain moving. That’s not the issue. The issue is that immigrant labor is recruited specifically because language barriers, immigration status dependencies, and unfamiliarity with U.S. labor law make them less likely to challenge exploitative conditions.
Sam Express filed a PERM labor certification with the Department of Labor, Case A-21127-83517, to sponsor a Kyrgyz national for a green card to work as a “Financial Analyst” at a five-employee trucking company paying $59,925 per year. The DOL’s Office of Inspector General has characterized the PERM program as “highly susceptible to fraud.” The certification requires two classified advertisements in a local newspaper to demonstrate that no American worker wants the job. In this case, that meant running an ad in the Chicago Tribune for a financial analyst position at a tiny Kyrgyz-owned trucking startup. The recruitment is designed to fail. The system certified it anyway.
The driver in the Indiana crash, Bekzhan Beishekeev, had been in the country for 14 months and held a CDL for seven. He had an ICE detainer. He was 30 years old, driving a Freightliner for a carrier in a network that recruits from Kyrgyzstan, trains through affiliated schools, and places drivers through its own pipeline. Whether he was adequately trained, supervised, and supported is a question the federal investigation will answer. But the pipeline that put him behind that wheel is the point.
Justice-involved individuals. People with criminal records face significant employment barriers. Trucking has historically been one of the few industries where a felony conviction doesn’t automatically disqualify you. This is, in many ways, a good thing. Giving people second chances is part of how society works. However, the operators running this growth model target justice-involved individuals not for rehabilitation, but because people with limited options accept worse terms, lower pay, and conditions that more experienced drivers would refuse.
Low-experience, low-skill drivers. This is where CDL schools enter the picture. The carrier either operates its own training school or partners with one. The school gets the student a CDL. The student gets a truck. The carrier receives a driver with no industry experience, no frame of reference for what constitutes legitimate operations, and a financial obligation to the school, the carrier, or both.
Secretary Duffy named “Aydana LLC” as a CDL training school now under federal investigation in connection with the Sam Express network. As of this publication, Aydana has no public website, social media presence, advertising footprint, or visible student testimonials. Its registered agent is associated with an address in the Philadelphia metro area, the same city where Beishekeev was based. We’ve previously documented the Dispatch Training Center in Schaumburg, Illinois, 15 minutes from Sam Express headquarters, which has graduated more than 4,800 students since 2019 and explicitly teaches people how to open new MC/DOT authorities.
The formula: recruit people who can’t get jobs elsewhere or don’t know better, train them through an affiliated or captive school just enough to pass the CDL test, put them in a leased truck with deductions that leave them netting a fraction of what was promised, and keep them moving freight because their alternatives are worse.
Step 4: The Insurance
Insurance is supposed to be the last real barrier to entry. It was designed to ensure that only carriers with adequate financial responsibility could operate on public highways.
It has largely collapsed.
I wrote about this recently. Will be writing about it again this week. The rise of instant-issue, non-underwritten insurance policies has fundamentally changed the risk landscape. A non-domiciled individual with no license, no office, and no particular concern for anyone’s safety can go online, enter information, self-attest to their qualifications, pay by credit card, and receive a policy within minutes. No safety program review. No maintenance standards verification. No driver qualification audit. Money in, policy out.
GEICO offers commercial truck insurance online. Progressive offers commercial truck insurance online. These are mainstream carriers that have effectively turned commercial motor vehicle insurance into a consumer product.
Below them sits another tier entirely: the subprime commercial carriers. The surplus lines insurers. The non-standard markets. The companies willing to write policies for operations nobody else will touch. Texas Insurance, Accredited Specialty, and others specializing in what they call “high-risk” coverage.
When I look at who’s covering a motor carrier, I can tell you almost immediately what kind of operation you’re dealing with. Subprime insurers cover subprime carriers. That’s not opinion. That’s pattern recognition from a quarter century in this industry.
Your reputable fleets, the ones with real safety programs, real maintenance shops, real driver qualification files, and real skin in the game, are not shopping for insurance on a website. They’re insured by Zurich. They’re in group captive programs. They’re in sole-member captives. Getting into one of those programs isn’t easy. It was never supposed to be.
A captive works like this: best-in-class motor carriers form their own insurance company. They own it. They control it. When claims remain low, profits accrue to members rather than to a corporate insurer’s shareholders. Entry requires underwriting. Real underwriting. Safety audits, loss runs, terminal visits, driver file reviews, and maintenance program evaluations. The barriers are high because the members have a financial interest in excluding poor operators.
The chameleon carrier doesn’t enter a captive program. The chameleon carrier gets an instant-issue policy from a carrier that didn’t ask questions, operates until there’s a catastrophic crash, folds the authority, walks away from the judgment, and opens a new authority with a new instant-issue policy. Often from the same insurer that covered them before.
In the Sam Express ecosystem, we documented an insurance broker operating out of Des Plaines, Illinois, whose agency entity showed no lines of authority on the NAIC Business Entity Search. No LOAs means no formal authorization from insurance carriers to place business on their behalf. The broker who sent me a Facebook friend request at 2 a.m. after my first article was published had held his individual license for barely a year. His agency’s owner has individual LOAs, but the business entity itself shows zero. The question of who is actually underwriting the policies in this network, and whether those policies are worth the paper they’re printed on, is one the federal investigation should be asking.
The federal minimum liability coverage for most trucking operations is $750,000. That number was set in the 1980s. Inflation-adjusted, it should be north of $5 million today. A single catastrophic truck crash can produce damages exceeding $20 million. The average nuclear verdict in truck crash litigation hit $36 million by 2022.
Minimum insurance. Maximum exposure. Zero assets. The entire model is designed to create a liability-proof shell that prints cash until someone dies, then dissolves and reconstitutes under a different name.
Step 5: The Growth
Now you understand the machine. Authority is cheap. Equipment is leased. Labor is exploitable. Insurance is a rubber stamp. Every component is designed to minimize the carrier’s capital at risk while maximizing cash flow.
The growth imperative is built into the model’s DNA. More trucks mean more settlement deductions. More drivers mean more dispatch fees. More authorities mean more flexibility to dodge enforcement. More entities mean more complexity for anyone trying to follow the money.
Sam Express Inc. has roughly 100 trucks on its FMCSA filing. KG Line Group claims 310. At the Broker Carrier Summit, they told brokers the holding group has 500. At the AITIM Awards in 2023, Sam Express was reported to have 350 trucks. The numbers don’t matter because the numbers aren’t the point. The point is that the operation is presenting different faces to different audiences: a disaggregated collection of small carriers to FMCSA, a unified fleet to brokers and shippers, a community success story to the diaspora, and a corporate growth engine to the consulting firm that takes a piece of everything.
Growth also requires infrastructure. Dispatch operations. Back-office support. Accounting. Marketing. AITIM Group, the consulting firm that gave Sam Express “Best Trucking Company of the Year,” claims a network of 70,000 trucks on its LinkedIn page. They offer consulting, safety services, TMS, ELD, and media services. The Hero ELD, developed by AITIM Inc., is the electronic logging device allegedly referenced in a federal civil complaint as having “backdoor” capabilities for remote manipulation of hours-of-service records.
PixelCo, an AITIM Awards winner, is described as “a leader in marketing in the trucking industry of the USA” offering “everything from brand formation and corporate identity to full-scale PR.” The Dispatch Training Center in Schaumburg has graduated 4,800-plus students in how to open authorities and run dispatch operations. The Silk Road International School has headquarters in Bishkek, Kyrgyzstan. Codewise Academy trains IT professionals.
It’s a vertically integrated ecosystem. From recruiting drivers overseas to training dispatchers in Schaumburg to marketing carriers through a digital agency to logging hours on a proprietary ELD to celebrating the whole thing at a black-tie gala, every link in the chain has a dedicated service provider and every service provider is part of the same community network.
Step 6: The Crash
The model meets physics.
When you put a driver with seven months of CDL experience behind the wheel of a Freightliner on State Road 67 in Jay County, Indiana, and that driver fails to stop for slowed traffic and crosses the centerline into oncoming traffic, four people die.
The Government Accountability Office found that chameleon carriers are three times more likely to be involved in serious crashes than legitimate new entrants. From 2005 to 2010, 18 percent of carriers with chameleon attributes were involved in severe crashes, compared to just 6 percent without those red flags. From 2016 to 2022, fatal crashes involving large trucks increased 26.4 percent. Nearly 5,500 people die in truck-involved crashes every year. Eighty-two percent of fatalities are people in other vehicles, pedestrians, or cyclists.
Tutash Express Inc., one carrier in the Sam Express network, has recorded 57 crashes and over 1,800 inspections. Its Unsafe Driving BASIC score sits at 92.5 percent, meaning it ranks worse than 92.5 percent of all carriers in the country. Across the broader network, we’re approaching 100 crashes combined. Tutash Express 1, whose authority was involuntarily revoked in July 2024, reported 128,962 miles driven in 2025 , while operating under revoked authority , with a 100 percent vehicle out-of-service rate.
The crashes are the predictable output of a business model that prioritizes growth over safety, cash flow over compliance, and scale over human life.
The Pattern
Every major predatory lease carrier scandal in the past decade follows the same template.
Super Ego Holding: multiple affiliated carriers operating as alter egos. Drivers shuffled between authorities. Falsified rate confirmations. Predatory lease terms. Class action lawsuit now potentially involving 10,000 to 20,000 plaintiffs. Elmhurst, Illinois, hub generating chronic nuisance calls to police for violence and theft.
The Sam Express network: 20-plus affiliated carriers sharing VINs, terminal addresses, officers, and branding. Federal civil complaint alleging a “unified fraudulent enterprise.” Predatory leasing. Falsified rate confirmations. ELD backdoor allegations. Immigration pipeline. CDL school under federal investigation. Four dead in Indiana.
The details change. The geography shifts. The ethnic communities are different. The formula is identical.
Acquire authority cheaply. Lease equipment to avoid capital exposure. Recruit vulnerable labor to suppress operating costs. Obtain minimum insurance to satisfy regulatory requirements. Scale aggressively by replicating the model across multiple entities. Extract maximum revenue through deductions, fees, and falsified accounting. When enforcement catches up, close the authority and open a new one. Keep the trucks. Keep the drivers. Change the name.
Repeat until someone dies. Then repeat again.
What Breaks the Cycle
Insurance underwriting was supposed to be the filter. It failed when instant-issue policies rendered coverage trivial to obtain without scrutiny.
New-entrant safety audits were intended to serve as the filter. They failed when the volume of applications overwhelmed FMCSA’s capacity to conduct them.
ARCHI was supposed to catch reincarnated carriers at the application stage. It failed when the volume of registrations rendered screening through the process impossible.
The Truth in Leasing Act was supposed to protect drivers from predatory operators. It failed when enforcement was complaint-driven, and most victims didn’t know they had rights.
What’s left is what Secretary Duffy is doing right now: targeted, post-crash, on-terminal investigations with real consequences. Out-of-service orders. Revocations. Criminal referrals. Following the money, the corporate structure, the insurance pipeline, and the training school.
It shouldn’t take four dead Amish men in Indiana to trigger that level of scrutiny. But that’s the system we have. And until the barriers to entry actually function as barriers, the formula will continue to work for those willing to run it.
The growth model isn’t a secret. It’s barely even a strategy. It’s just math: minimize your costs, maximize your revenue, externalize your risks onto drivers, insurers, and the general public, and move fast enough that enforcement can’t keep up.
The people driving these operations know something is wrong. They feel it in their settlement statements. They see it when the truck they’re driving has a different company name on the door than the one on their lease agreement. They understand it when they’re told to keep driving after the ELD shows they should be in a bunk.
They keep driving because the alternatives are worse, they have families, and someone promised them a chance to own their own truck and the American dream.
The American dream doesn’t usually end on State Road 67 in Jay County, Indiana, with the coroner documenting multiple blunt force trauma injuries on four men who were just riding in a van on a Tuesday afternoon.
But this one did. As with Richard Hutchinson Wright, Danny Tiner, and many other drivers, the driver is often the one left bearing justice-related consequences, while the carrier closes and the owners move on with their lives and a pile of money.